Workflow
New Run from a Template
If you are a new user, you need at least one backtest to start. You can start with a template or with a shared job.
In our example, we will create and tune the public template Short Strangle.
First, we are running the backtest with the default settings.
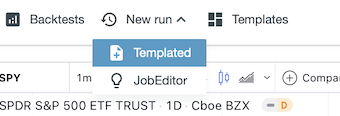
Click New run > Templated.
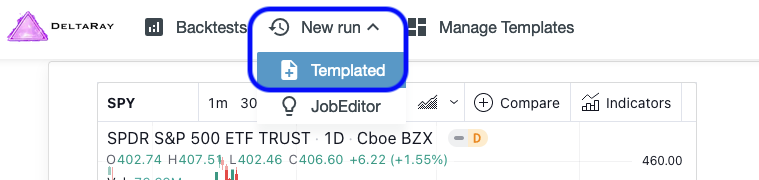
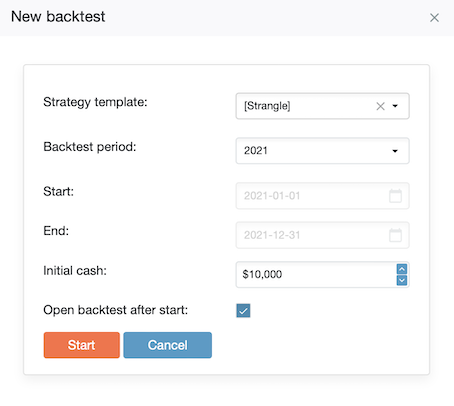
Pick [Strangle], hit Start.
The job will start to execute, and the backtest details will be shown shortly:
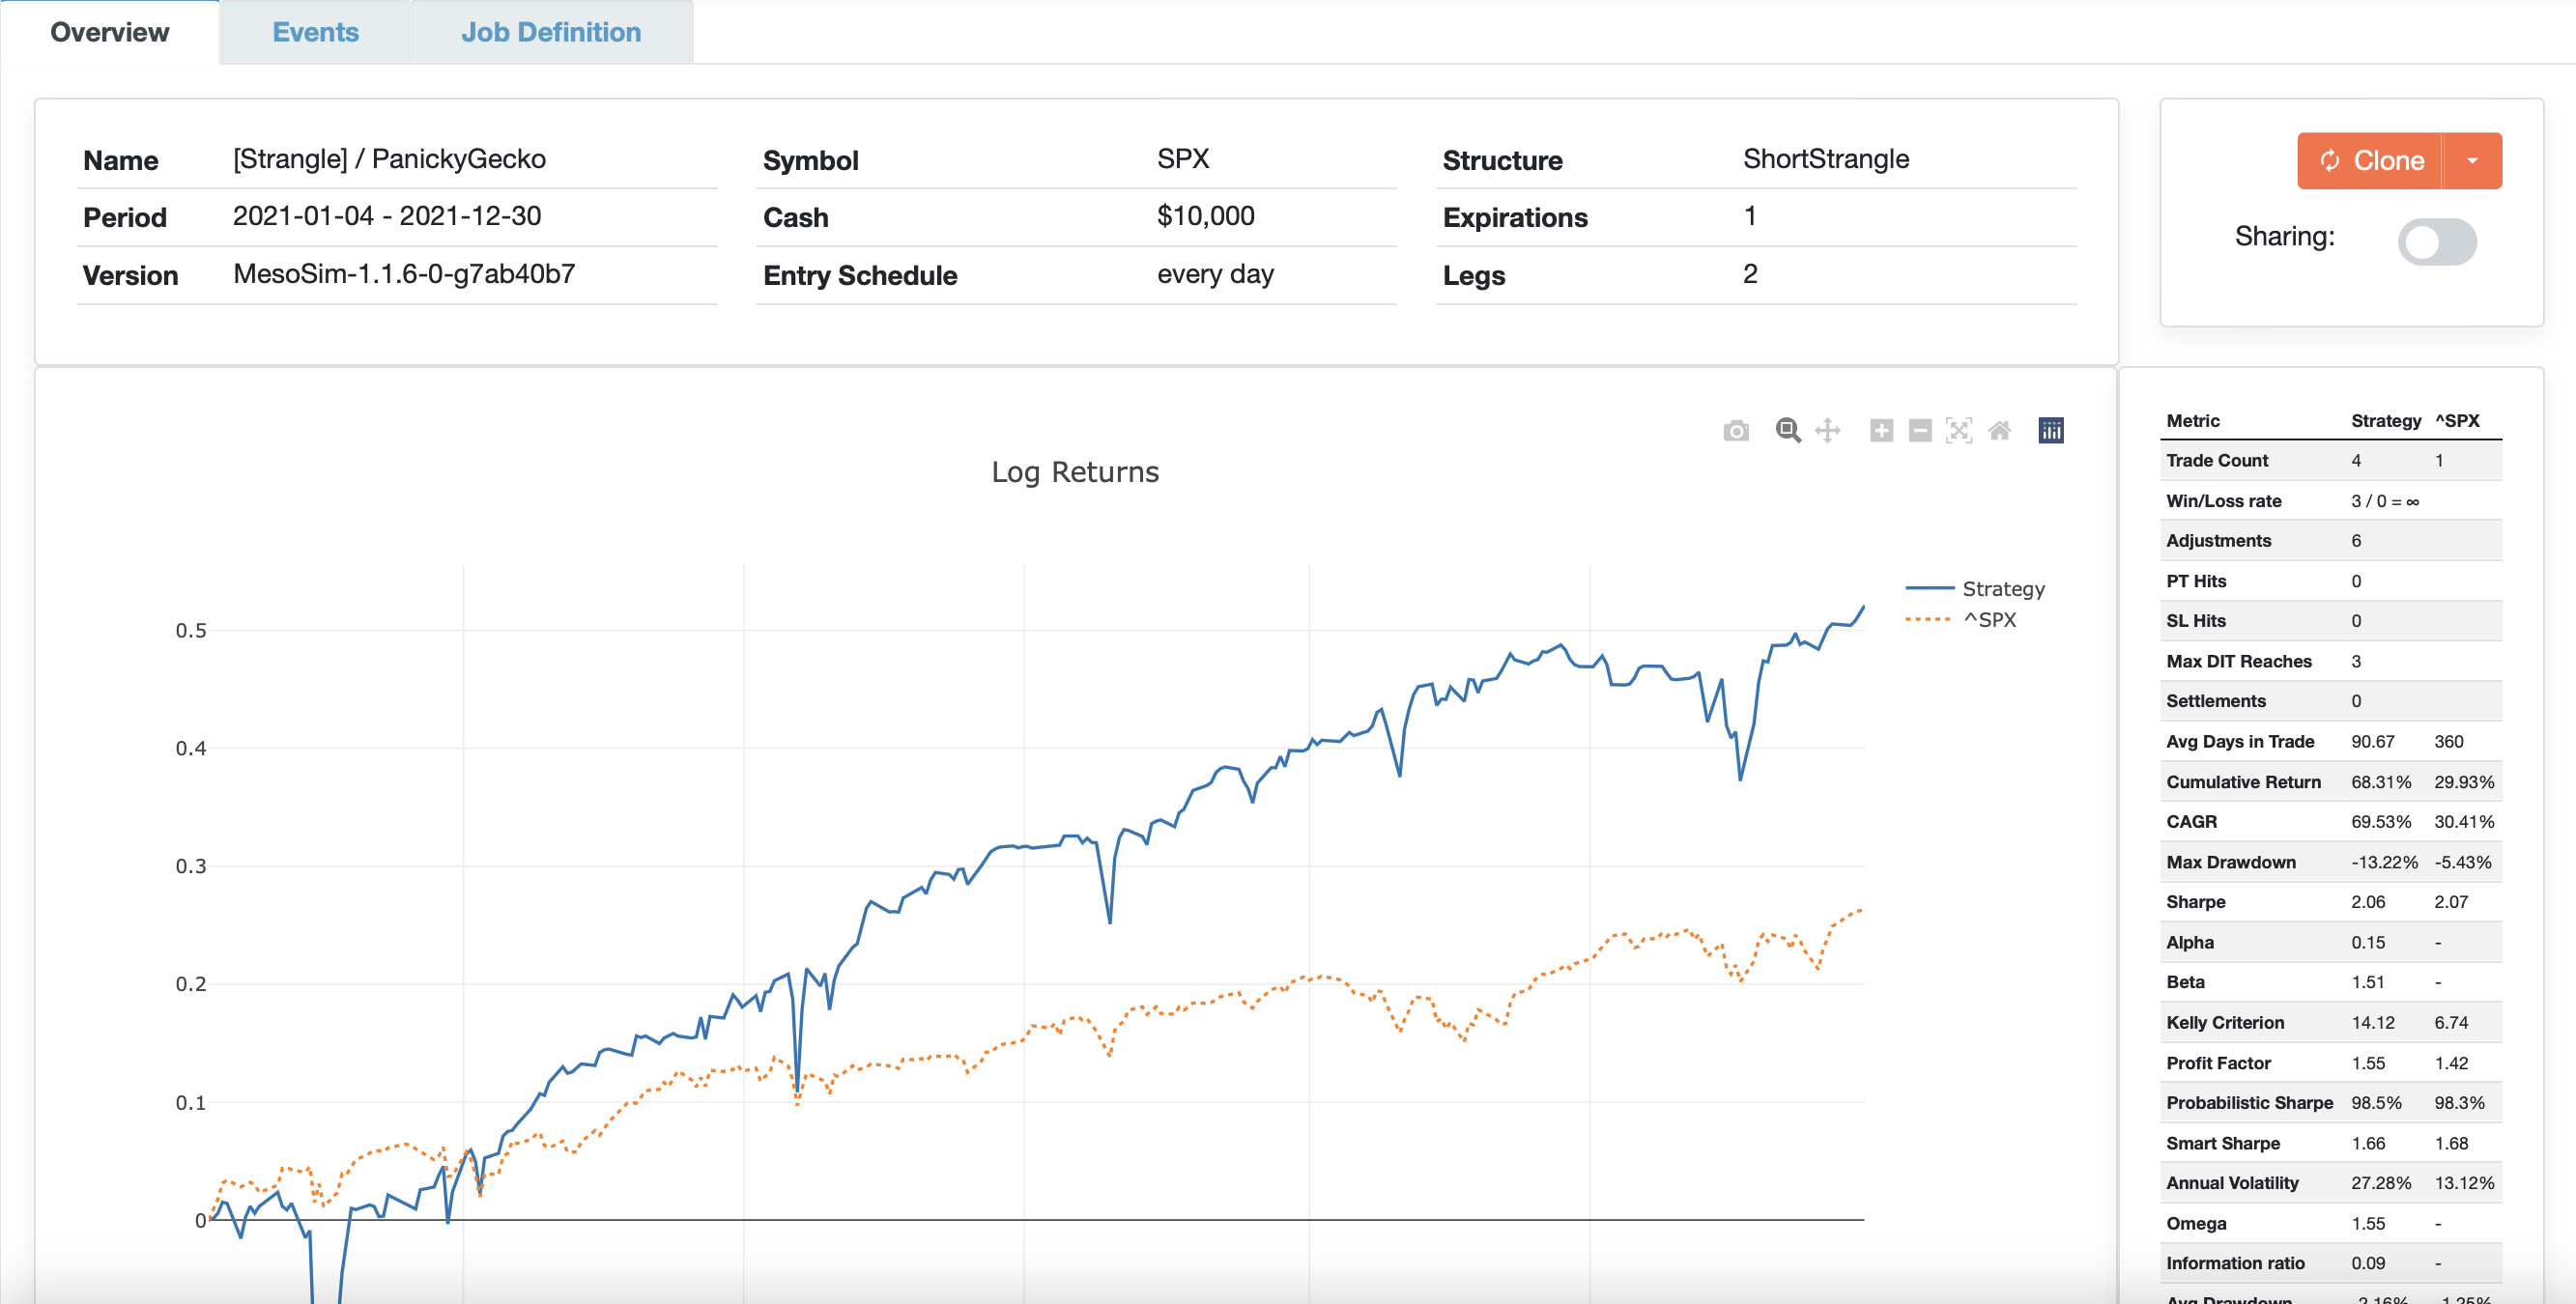
Our Cumulative Return for this backtest is 68.31%, and the Max Drawdown is -13.22%, both higher than SPX’s respective statistics for this period.
Let’s see if we could achieve better results by staying longer or shorter in the positions.
Finetuning the test - Iterate via Cloning
Already performed backtests are read-only, so you will need to clone, edit and run a new backtest each time you want to make a change.
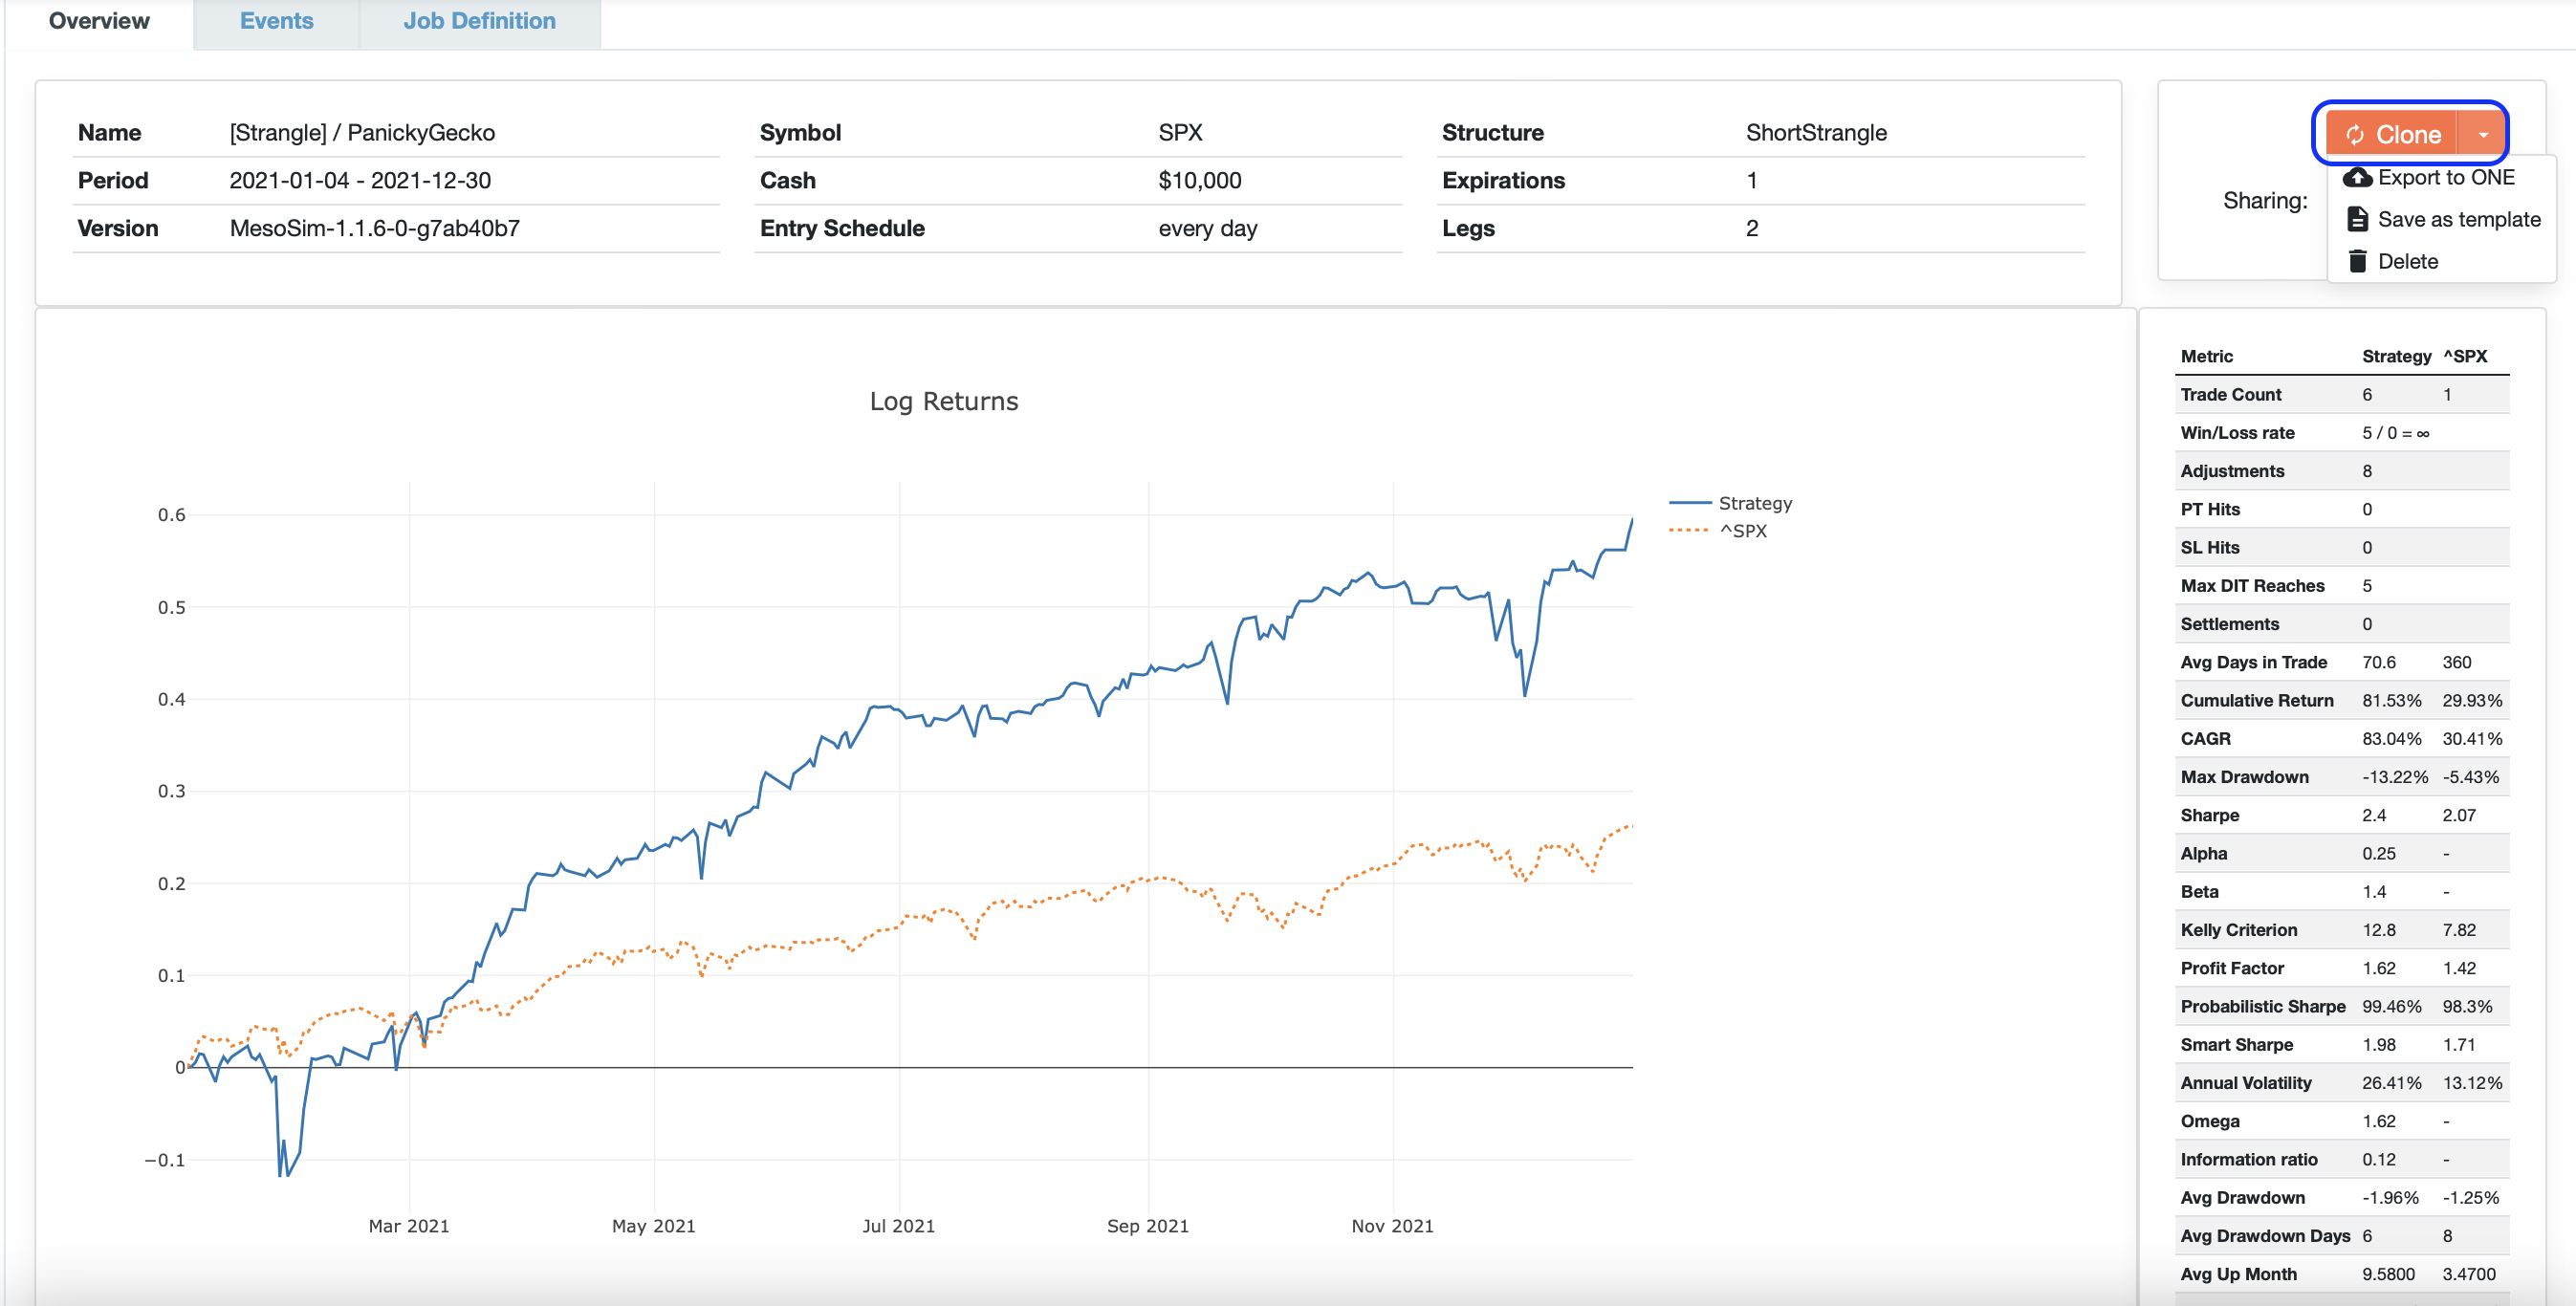
Click Clone to iterate on the job.
Note: the dropdown menu next to it will be used in our next step.
Clicking Clone will bring up the Job Editor, where you can change variables and modify the backtest based on your observations.
If you only want to adjust one variable, we recommend you switch to the tree view of the Job Editor:
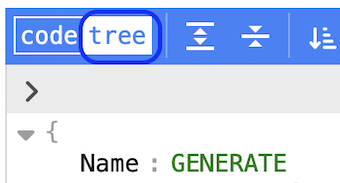
Double-click the value you want to change.
When you are done, hit Run to initiate a new backtest.
We are adjusting the variable MaxDaysInTrade in this example:
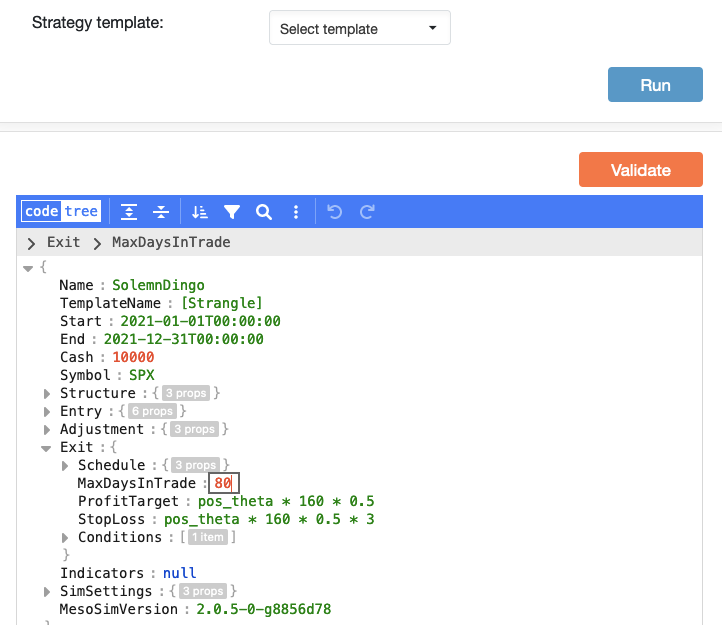
When you are done, hit Run to initiate a new backtest.
Keep iterating: Clone -> Edit -> Run until you are happy with your results.
Validation of Job Changes
To offer a better user experience, we provide early and clear warnings when the job under execution is malformed or violates the execution requirements.
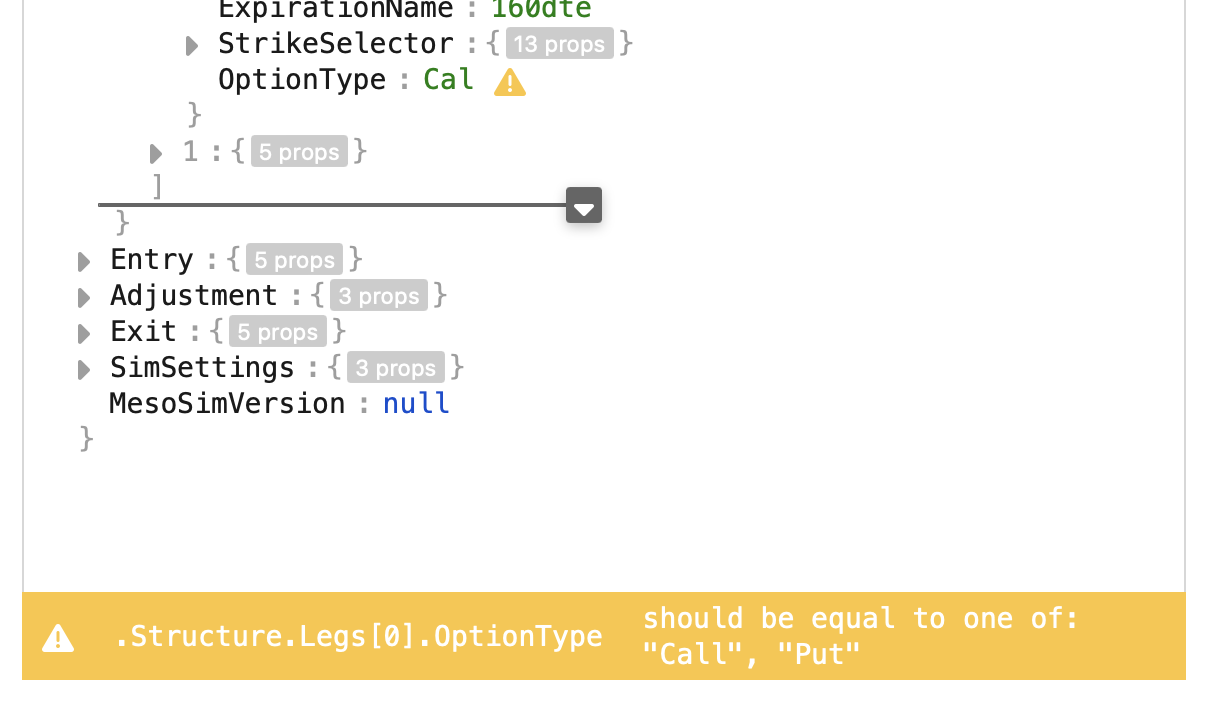
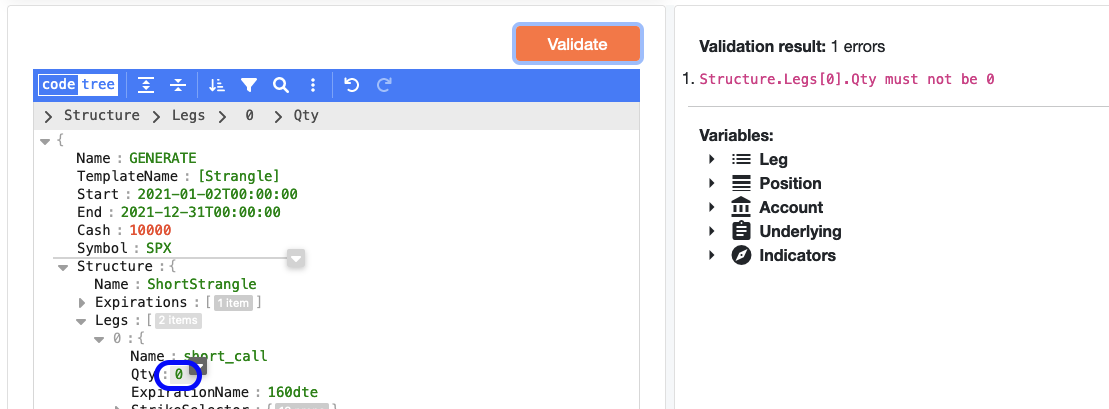
JSON syntax errors are immediately highlighted with yellow on the bottom of the screen (scroll all the way down!). At the same time, the underlying business logic is validated using the “Validate” button, on the right-hand side of the panel.
Example of warning for two malformed entries (one JSON syntax error and one business logic error):
Working with Templates
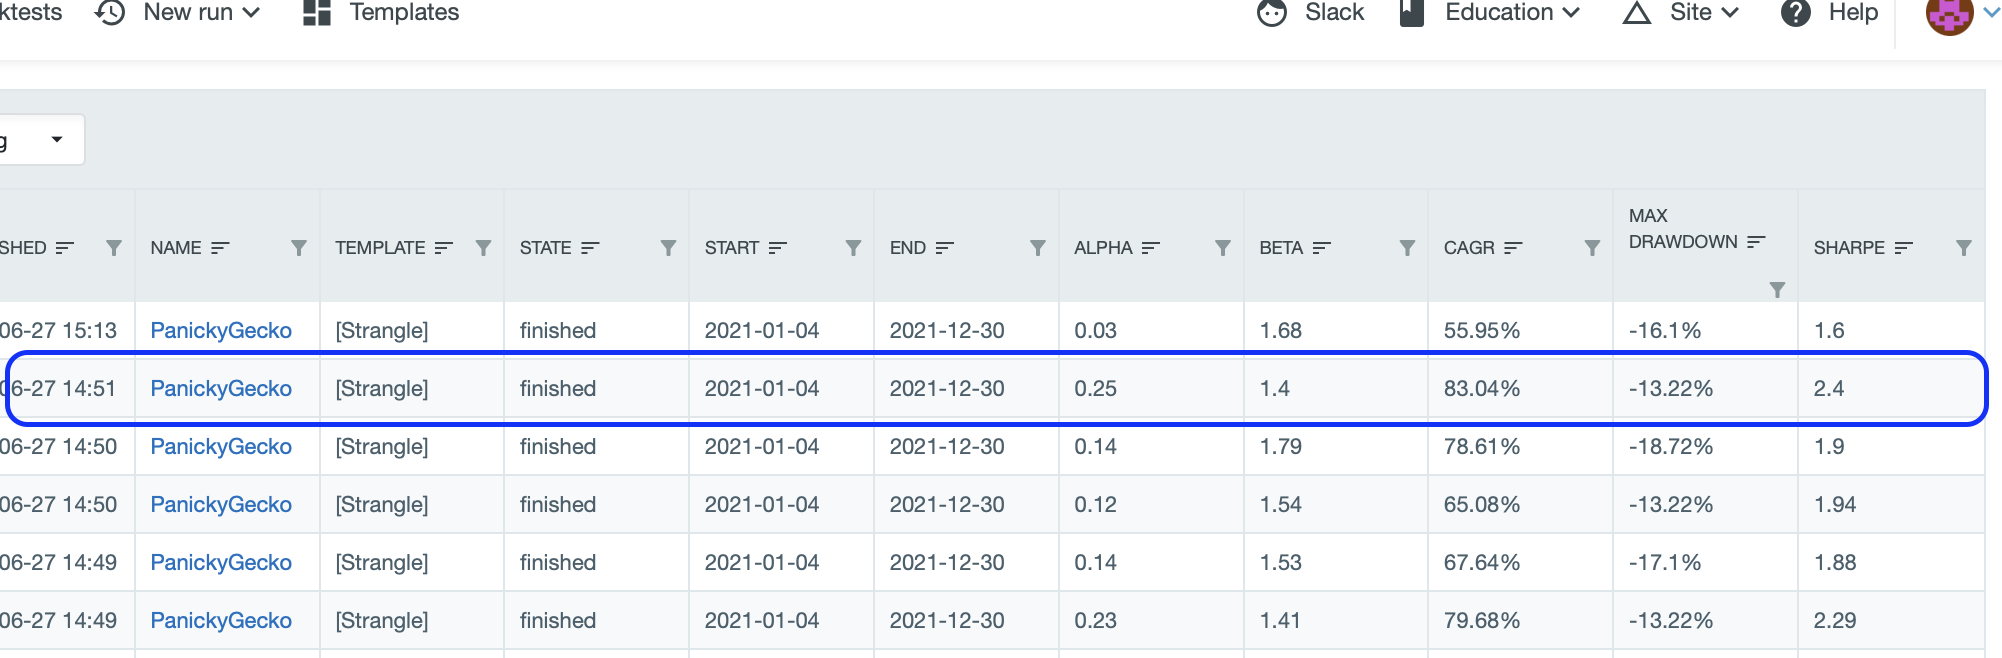
You can review all of your previous backtests on the Backtests page.
You can add or remove columns as desired.
We are saving our best-performing test as a template.
Managing Templates
Templates are milestones of strategies that serve as a starting point for further backtests.
Templates can be managed on the Templates tab. However, this tab doesn’t provide the option to run backtests. For this, please go back to Backtests or New Run - Templated.
Saving a job as a Template
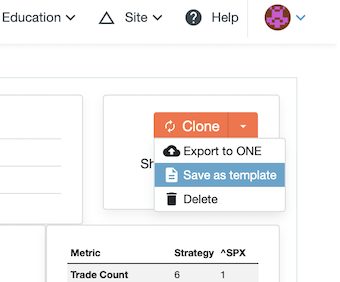
In our previous example, the strategy with ‘MaxDaysInTrade: 70’ brings the best results (in terms of Sharpe), so let’s save it as a template.
Open the specific backtest, hit the dropdown menu next to the Clone button, and choose "Save as template":
The OK button that saves the template will become active once you start typing a new template name.
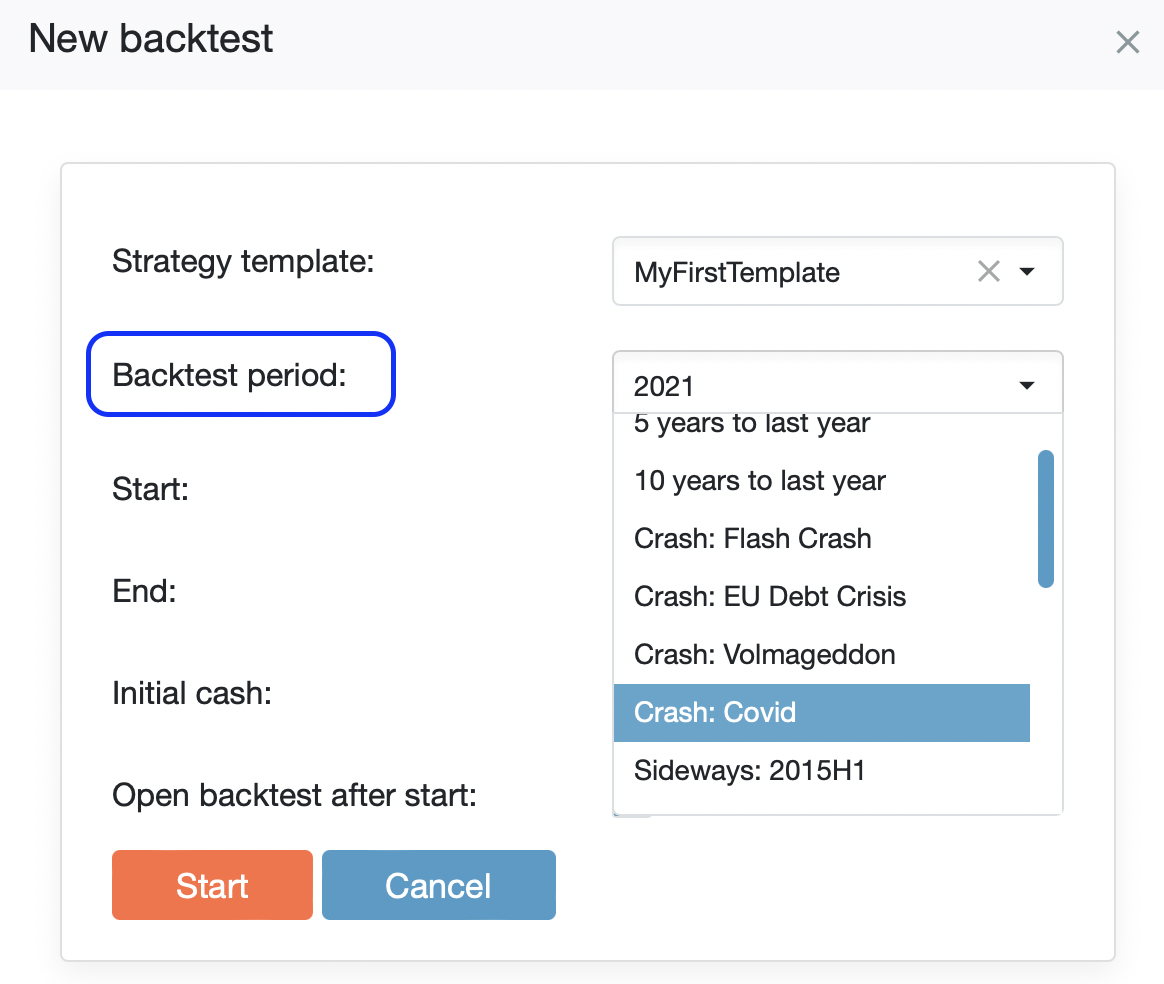
The tool has several major market crash periods, up and down periods pre-defined.
We want to test how this strategy would have performed during the Covid crash.
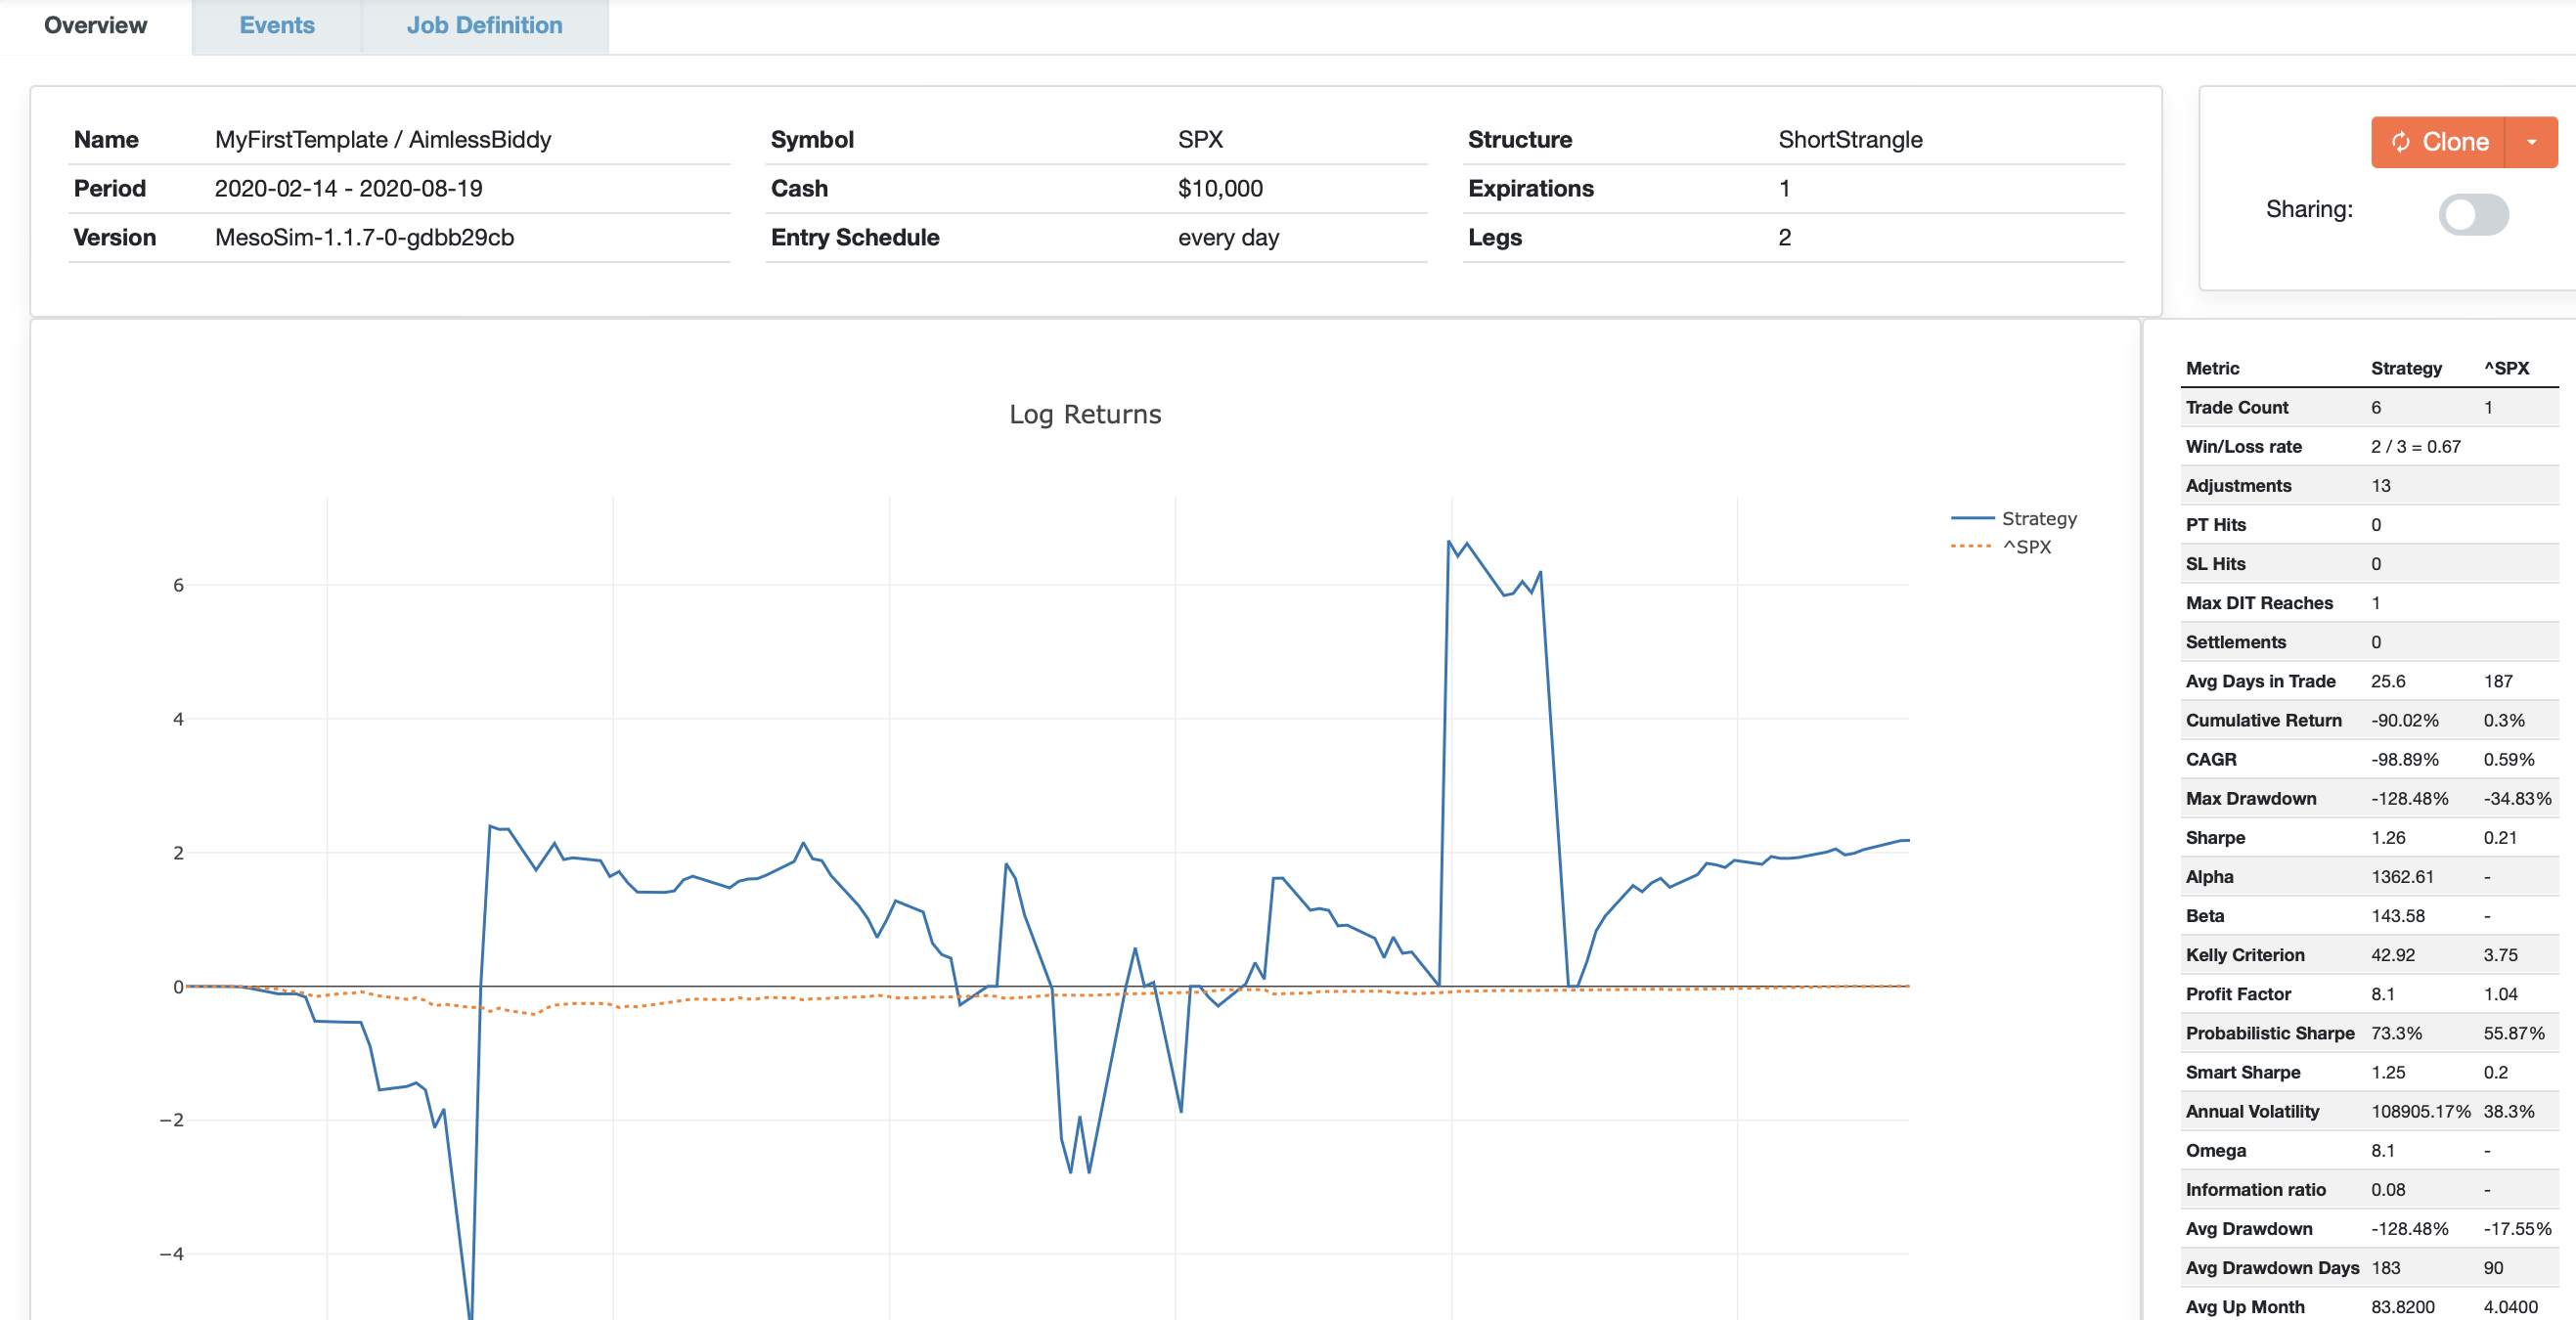
After starting the test, we observe that the test results for this period are not great.
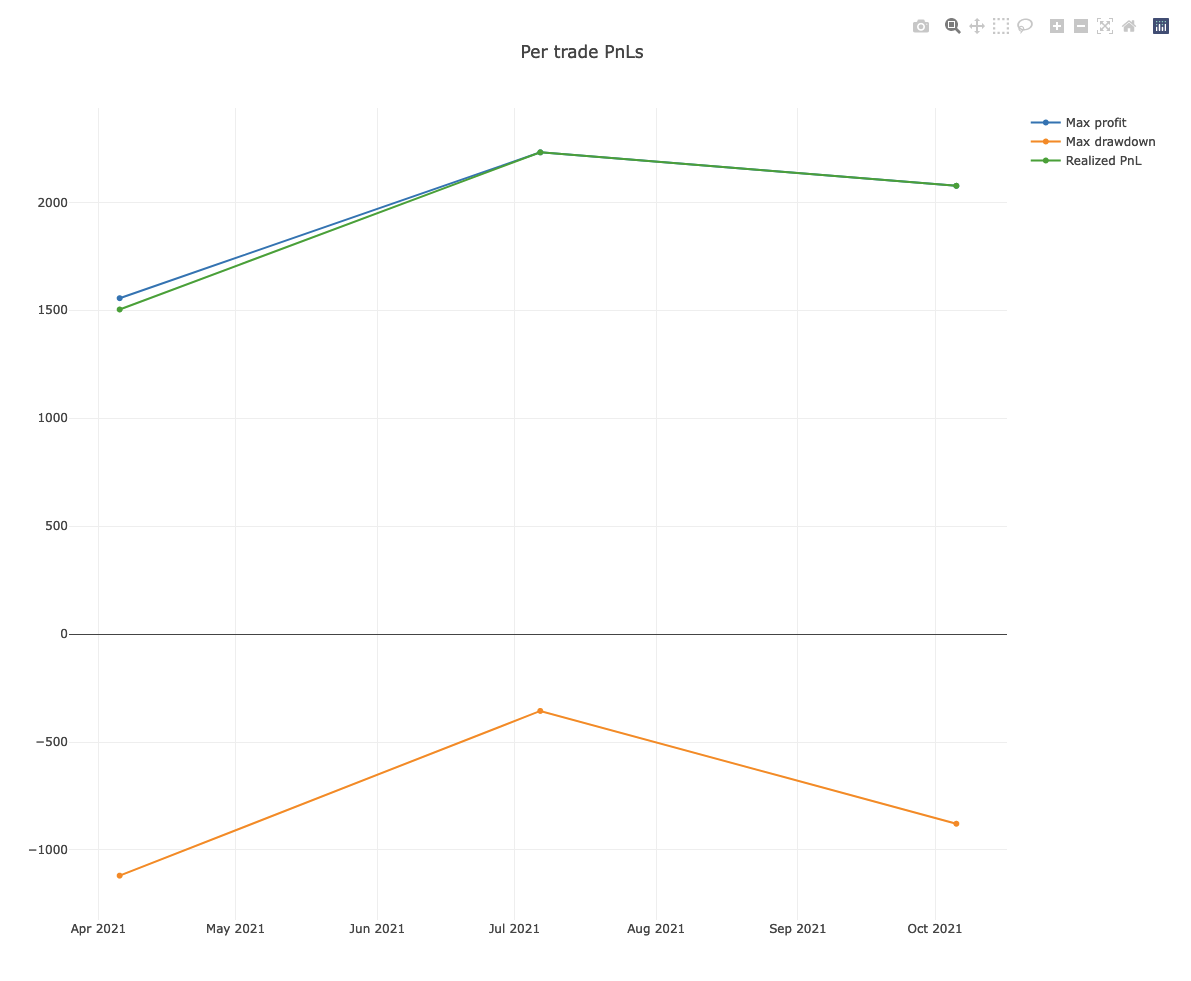
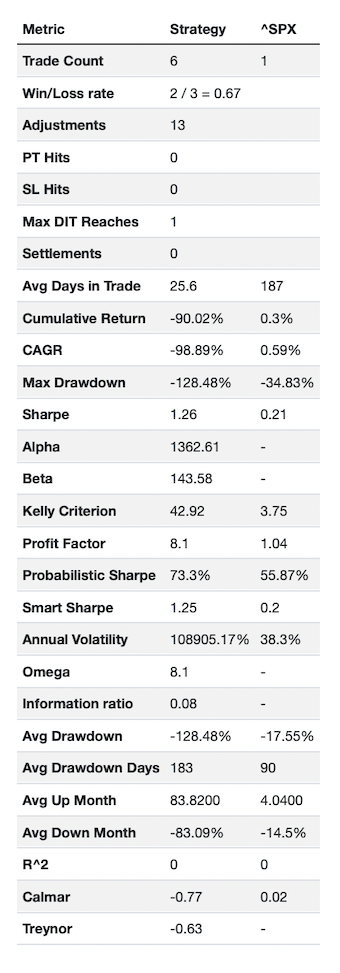
The cumulative return is -90.02%, with a max drawdown of -128.48%:
If you are not experienced with options trading, here is a hint of what went wrong:
Options can be considered as insurance bought or sold. We created a steady income with the Short Strangle scenario by selling insurance via naked options. This works very well in a bullish environment (such as 2021), but in case of a crash, we have no protection in place.
How do we get protected? We buy insurance (e.g., long puts).
That’s how one will end up trading complex structures, such as Iron Condors or Butterflies.
Mastering those structures involves understanding their risk characteristics (represented by greeks: Delta, Gamma, Vega) and coming up with a cost-efficient plan which provides enough protection to survive market crashes while creating a steady income.
Reading the Results
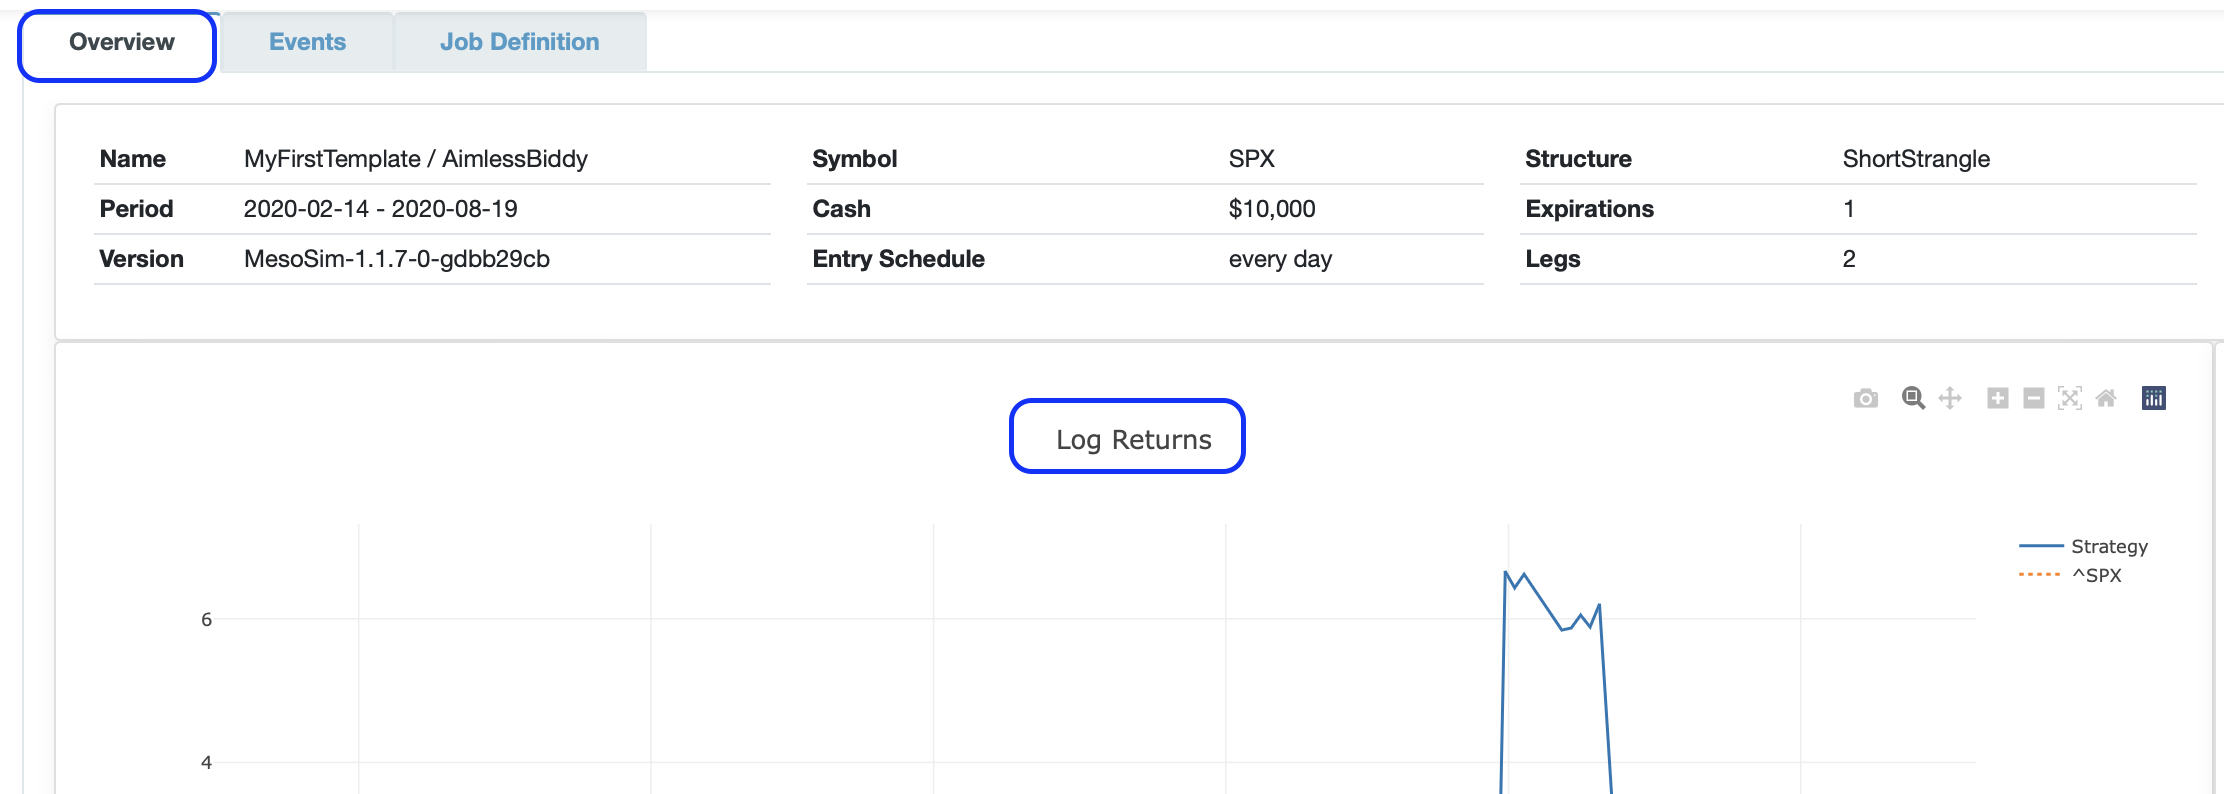
We already saw the results of the run on the previous screenshot; let’s quickly go through the remaining elements of the results screen.
At the top of the Overview tab, the high-level details of the strategy are shown, including the name of the Structure and the number of legs.
As the title of the PnL graph indicates, we are using Log Returns. It’s an industry best practice, which is necessary to display returns accurately over a more extended period in time series.
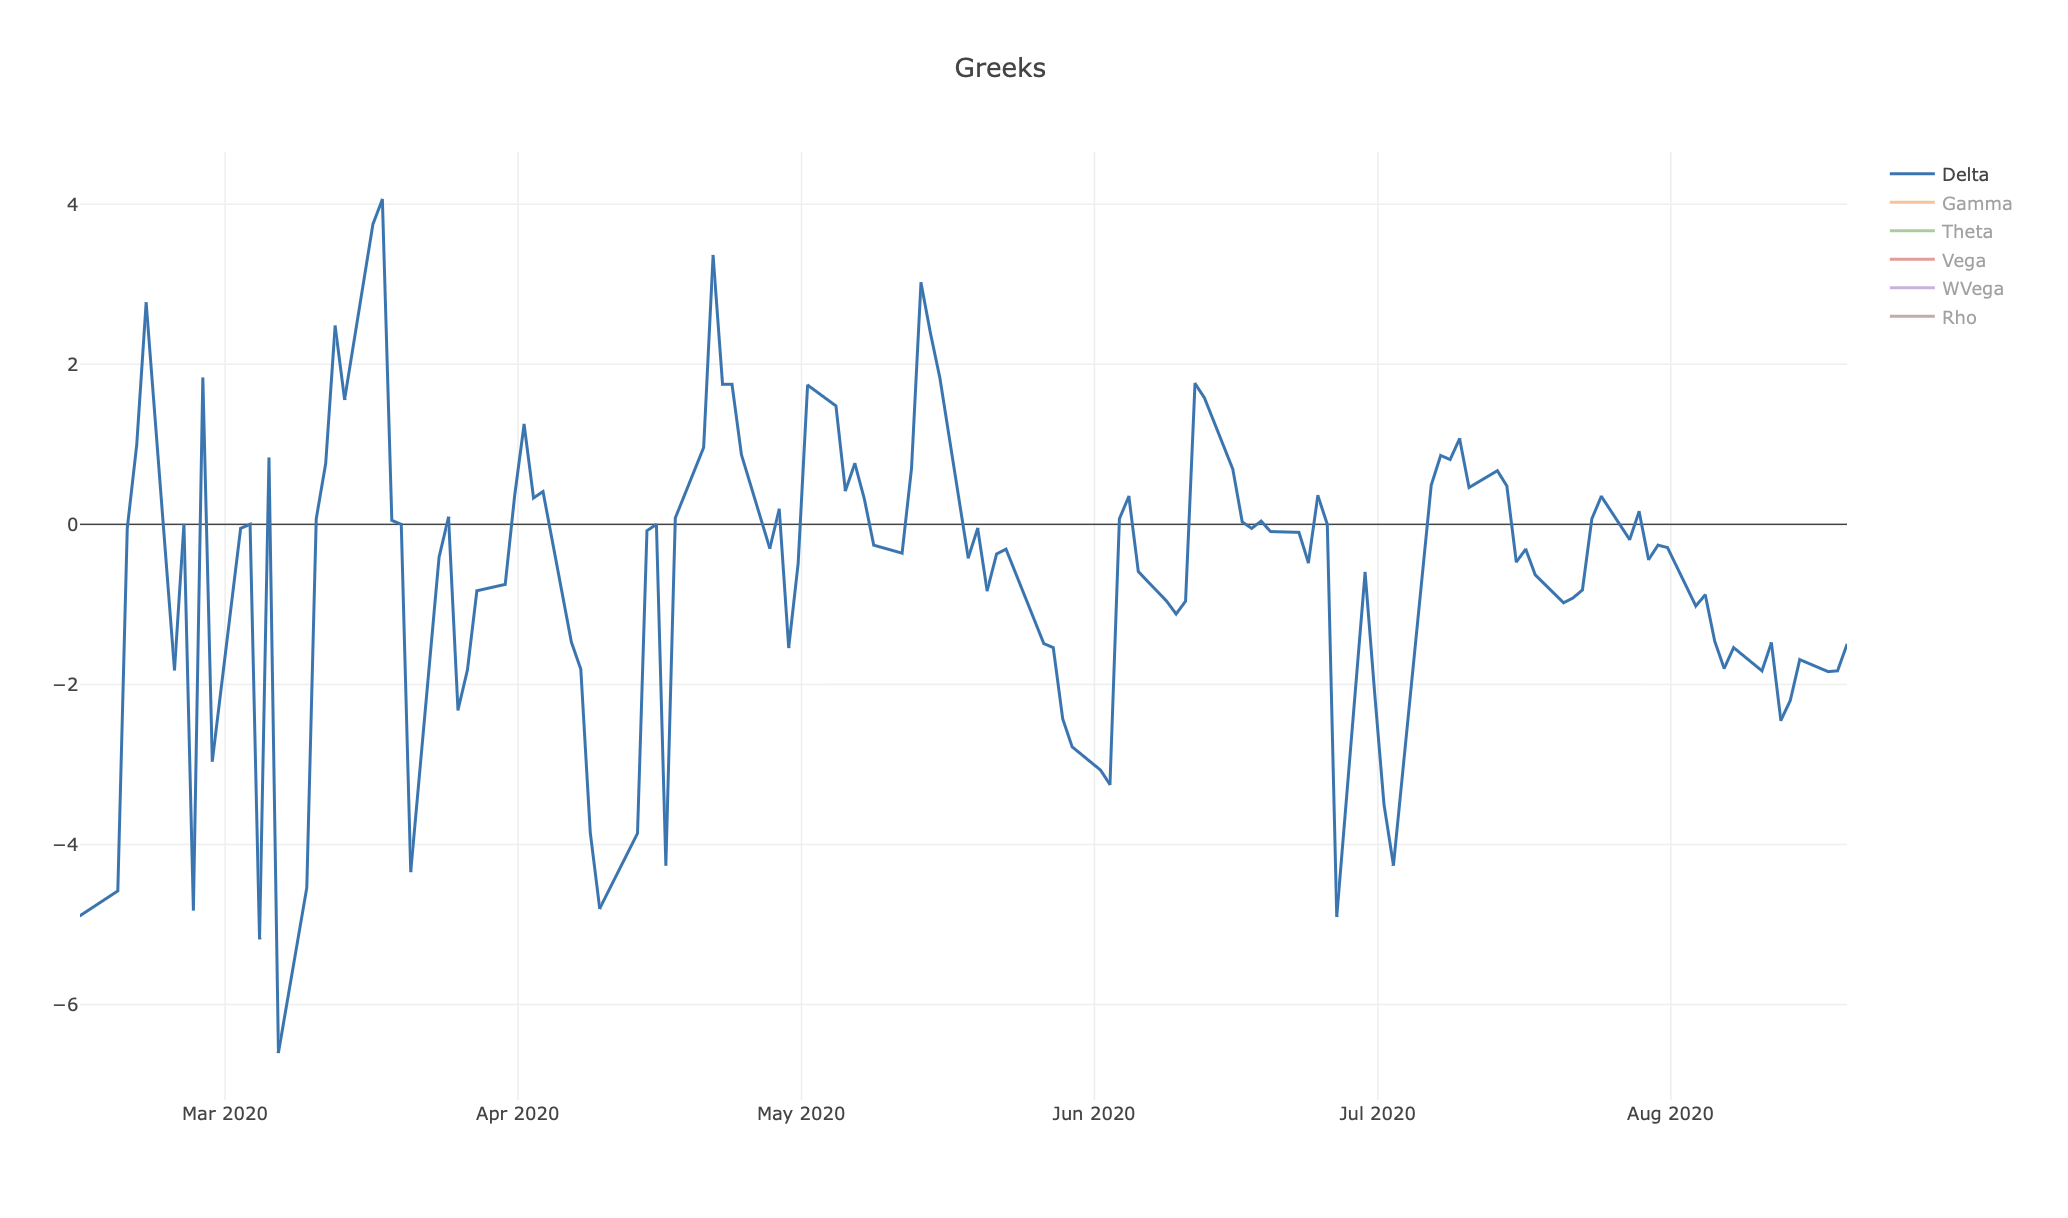
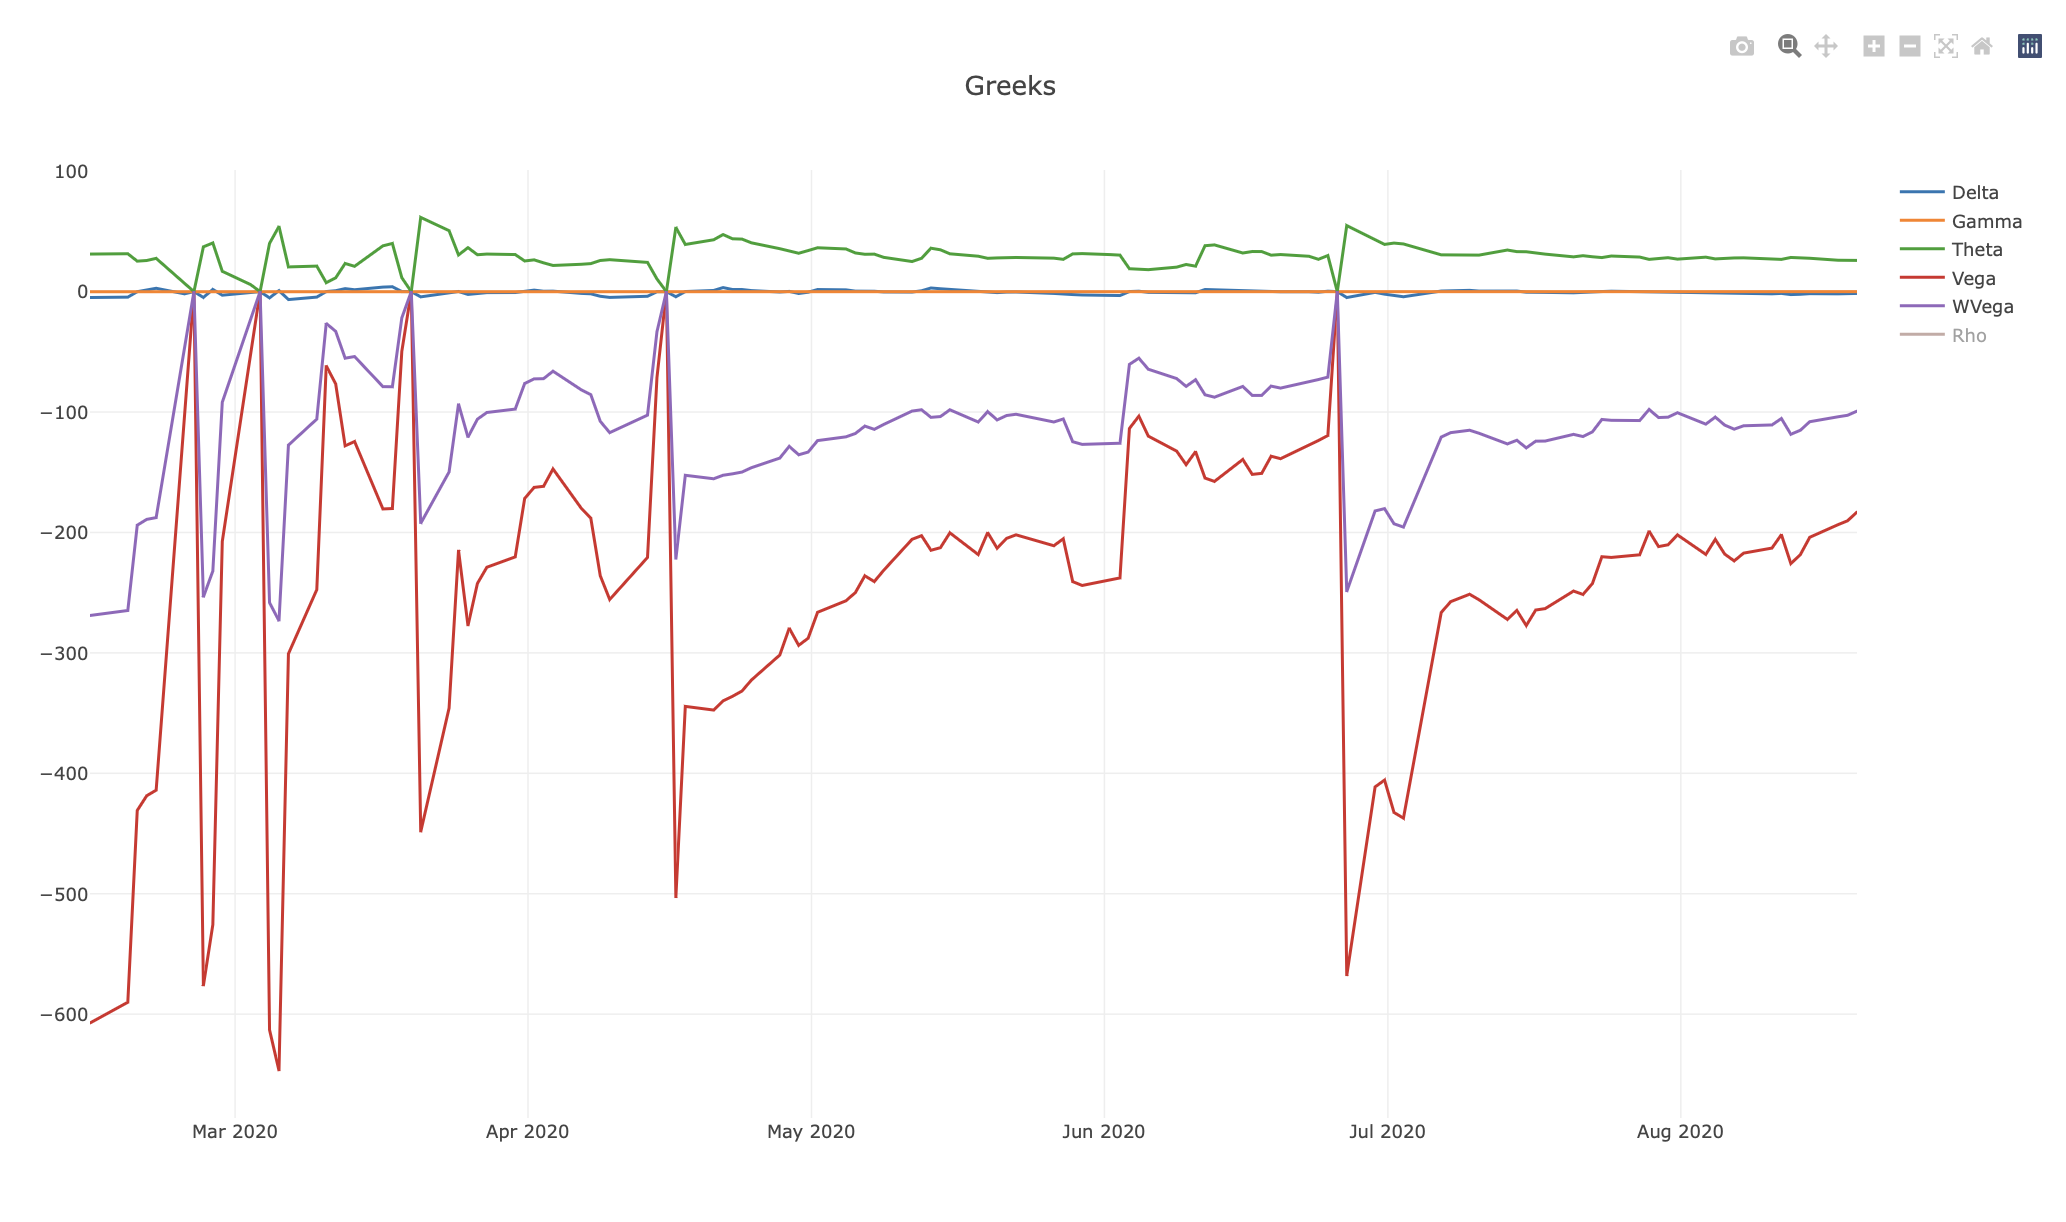
Greeks
Under the Log Returns graph, the second graph displays the trend of the greeks of the strategy for the whole run. By default, it’s set to display the Delta, but by clicking the names, you can switch on all other greeks as well.
PnL Graph
Analytics
On the right-hand side of the screen, there is a comprehensive selection of strategy metrics available, next to the Benchmark (SPX) metrics for the same period.
Observability of each backtest action - Events viewer
The Events Tab was explicitly designed to provide in-depth observability for each trade.
We wanted to deviate from the black box approach used by some of the available backtesting applications and display all actions executed during the backtesting run.
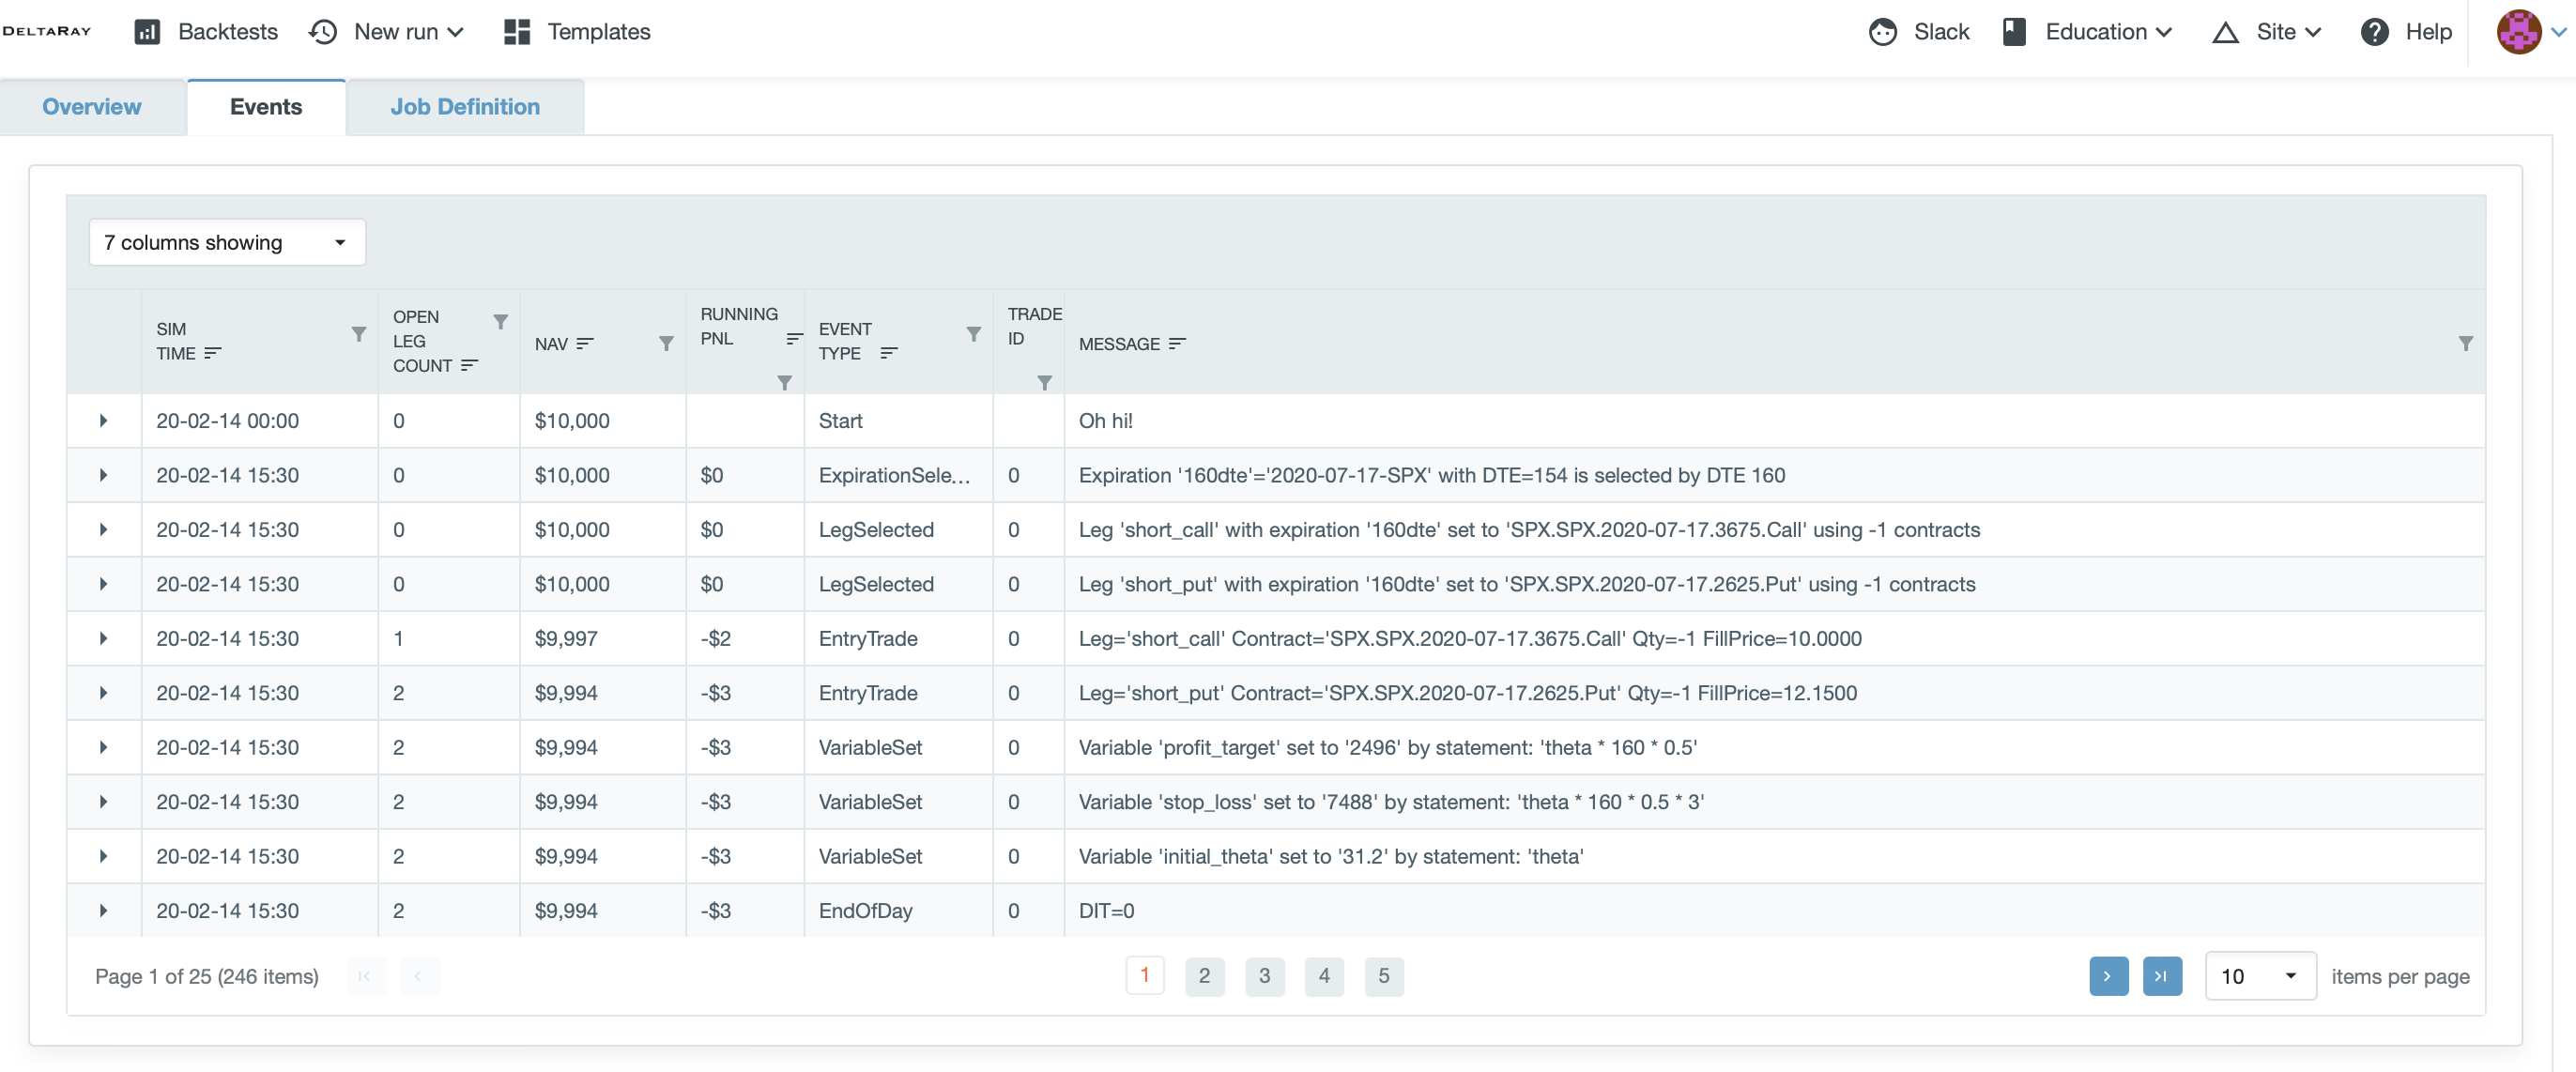
If you click into the table, the keyboard navigation becomes active, you are now able to use the ← and → keys to scroll through the pages.
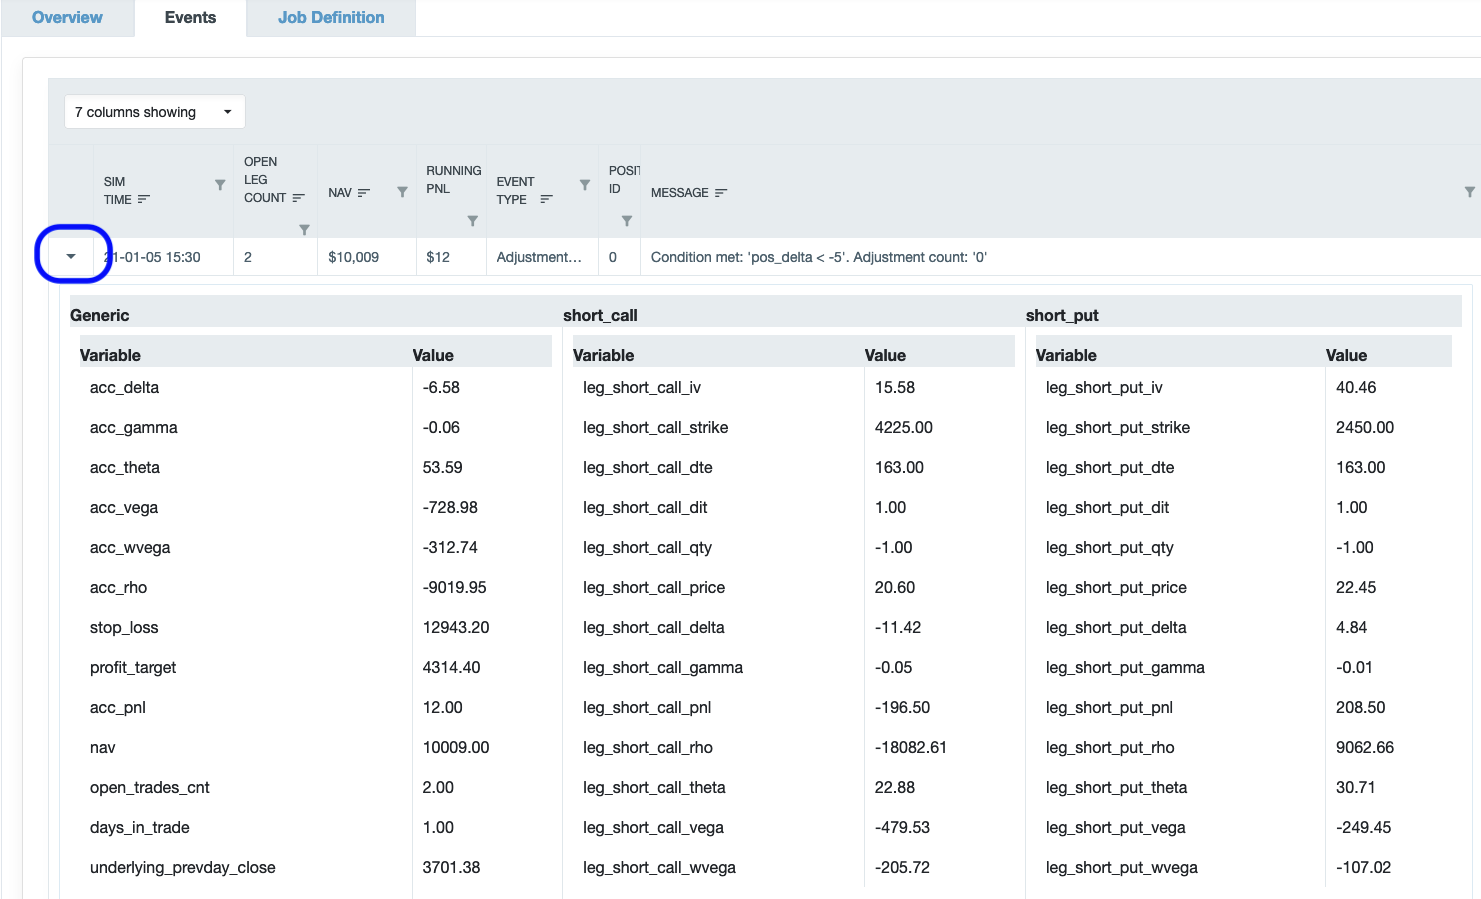
Additionally, you are able to access the values of each of the variables at the given point in time by clicking the triangle in the leftmost column of the table.
Sharing of Results
Your backtest results are visible only to you by default. If you wish to share a particular run with someone, click on the Share radio button to enable sharing:
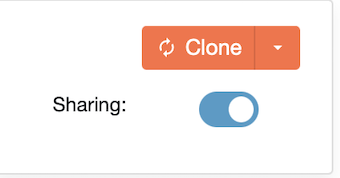
When sharing is enabled, others who have the URL of your backtest will be able to see all the run details: PnL graph, Events, and Job Definition, and can clone from your backtest.
Please note that we require all users to be authenticated; therefore, if you share the link with someone, they must register at the site first.
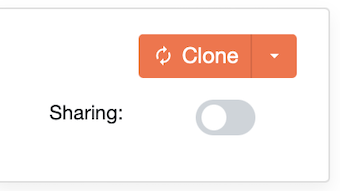
If you wish to disable sharing, click on the sharing radio button so that it becomes deactivated. When you disable sharing, your run will not be visible to others, even if they have the URL:
To illustrate sharing, we provide the ‘best’ benchmark run in this tutorial.